Coredumps at Memfault Part 1 - Introduction to Linux Coredumps
One of the core features of the Memfault Linux SDK is the ability to capture and analyze crashes. Since the inception of the SDK we’ve been slowly expanding our crash capture and analysis capabilities. Starting from the standard ELF coredump, we’ve added support for capturing only the stack memory, and even capturing just the stack trace with no registers and locals present. This article series will give you a high level overview of that journey, and give you a deeper understanding of how coredumps work on Linux.****
In this article we’ll start by taking a look at how a Linux coredump is formatted, how you capture them, and how we use them at Memfault.
Table of Contents
What is a Linux Coredump
A linux coredump represents a snapshot of the crashing process’ memory. It can be loaded into programs like GDB to inspect the state of the process at the time of crash. It is written as an ELF1 file. The entirety of the ELF format is outside the scope of this article, but we will touch on a few of the more important bits when looking at an ELF core file.
What triggers a cordump
Coredumps are triggered by certain signals generated by or sent to a program. The full list of signals can be found in the signal man page2. Here are the signals that cause a coredump:
- SIGABRT: Abnormal termination of the program, such as a call to abort.
- SIGBUS: Bus error (bad memory access).
- SIGFPE: Floating-point exception.
- SIGILL: Illegal instruction.
- SIGQUIT: Quit from keyboard.
- SIGSEGV: Invalid memory reference.
- SIGSYS: Bad system call.
- SIGTRAP: Trace/breakpoint trap.
Of these the most common culprits you’ll likely see are SIGSEGV, SIGBUS, and
SIGABRT. These are signals that will be generated when a program tries to
access memory that it doesn’t have access to, tries to dereference a null
pointer, or when the program calls abort. These typically indicate a fairly
serious bug in either your program, or the libraries that it uses.
Coredumps are very useful in these situations, as generally you’re going to want to inspect the running state of the process a the time of crash. From the coredump you can get a backtrace of the crashing thread, the values of the registers at the time of crash, and the values of the local variables at each frame of the backtrace.
How are coredumps enabled/collected
Enabling coredumps on your Linux device requires a few configuration options. To start with you’ll need the following options enabled on your kernel at a minimum:
CONFIG_COREDUMP=y
CONFIG_CORE_DUMP_DEFAULT_ELF_HEADERS=y
These settings will enable the kernel to generate coredumps, as well as set the
default mappings that are present in the coredump. man core3
provides a good overview of the options available to you when configuring
coredumps.
core_pattern
The kernel provides an interface for controlling where and how coredumps are
written. The /proc/sys/kernel/core_pattern3 file provides two
methods for capturing coredumps from crashed processes. A coredump can be
written directly to a file by providing a path directly to it. For example if we
wanted to write the core file to our /tmp directory with both the process name
and the pid we would write the following to /proc/sys/kernel/core_pattern.
/tmp/core.%e.%p
In this example %e expands to the name of the crashing process, and %p
expands to the PID of the crashing process. More information on the available
expansions can be found in the man core3 page.
We can also pipe a coredump directly to a program. This is useful when we want
to modify the coredump in flight. The coredump is streamed to the provided
program via stdin. The configuration is similar to saving directly to a file
except the first character must be a |. This is how we capture coredumps in
the Memfault SDK, and will be covered more in depth later in the article.
procfs Shallow Dive
An additional benefit to the core_pattern pipe interface is that until the
program that is being piped to exits, we have access to the procfs of the
crashing process. But what is procfs, and how does it help us with a coredump?
procfs gives us direct, usually read-only, access to some of the kernel’s data
structures4. This can be system wide information, or information about
individual processes. For our purposes we are interested mostly in the
information about the process that is currently crashing. We can get direct read
only access to all mapped memory by address through
/proc/<pid>/mem5, or look at the command line arguments of
the process through /proc/<pid>/cmdline6.
Elf Core File Layout
Linux coredumps use a subset of the ELF format. The coredump itself is a snapshot of the crashing process’ memory, as well as some metadata to help debuggers understand the state of the process at the time of crash. We will touch on the most important aspects of the core file in this article. We will not be doing an exhaustive dive into the ELF format, however, if you are interested in learning more about the ELF format, the ELF File Format1 is a great resource.
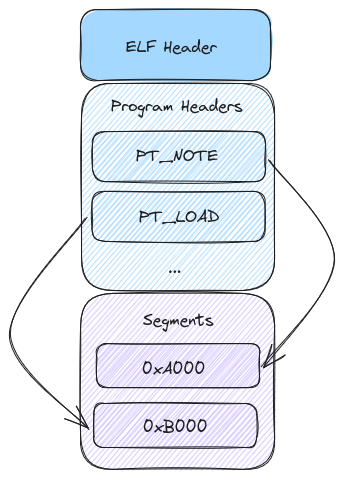
ELF Header
The above image gives us a very high level view of the layout of a coredump. To start, the ELF header outlines the layout of the file and source of the file. We can see if the producing system was 32-bit or 64-bit, little or big endian, and the architecture of the system. Additionally it shows the offset to the program headers. Here is the layout of the ELF header1:
typedef struct {
  unsigned char e_ident[EI_NIDENT];
  Elf32_Half e_type;
  Elf32_Half e_machine;
  Elf32_Word e_version;
  Elf32_Addr e_entry;
  Elf32_Off e_phoff;
  Elf32_Off e_shoff;
  Elf32_Word e_flags;
  Elf32_Half e_ehsize;
  Elf32_Half e_phentsize;
  Elf32_Half e_phnum;
  Elf32_Half e_shentsize;
  Elf32_Half e_shnum;
  Elf32_Half e_shstrndx;
} Elf32_Ehdr;
There is a lot going on here, but the fields that are most important to our discussion are broken down below:
-
e_ident: This field is an array of bytes that identify the file as an ELF file. -
e_type: This field tells us what type of file we are looking at. For our purposes this will always beET_CORE. -
e_machine: This field tells us the architecture of the system that produced the file. Common values here areEM_ARMfor 32 bit ARM, andEM_AARCH64for aarch64. -
e_phoff: This field tells us the offset to the program headers. -
e_phentsize: This field tells us the size of each program header.
Program Headers and Segments
The meat of our coredump exists in the program headers. There are a wide variety
of program header types defined in the Elf File Format1. From the
perspective of the coredump, however, we are primarily interested in the
PT_NOTE and PT_LOAD program headers.
Program headers have the following layout1:
typedef struct {
  Elf32_Word p_type;
  Elf32_Off p_offset;
  Elf32_Addr p_vaddr;
  Elf32_Addr p_paddr;
  Elf32_Word p_filesz;
  Elf32_Word p_memsz;
  Elf32_Word p_flags;
  Elf32_Word p_align;
} Elf32_Phdr;
Here is a brief breakdown of the fields we care about in the program header:
-
p_type: This field tells us what type of segment we are looking at. For our purposes this will be eitherPT_NOTEorPT_LOAD. -
p_offset: This field tells us the offset from the beginning of the file where the segment starts. -
p_vaddr: This field tells us the virtual address where the segment is loaded. -
p_paddr: This field tells us the physical address where the segment is loaded. -
p_filesz: This field tells us the size of the segment in the file. -
p_memsz: This field tells us the size of the segment in memory. -
p_align: This field tells us the alignment of the segment.
We’ll start by taking a look at the format of the PT_NOTE segments. Below is
the layout of a PT_NOTE segment.
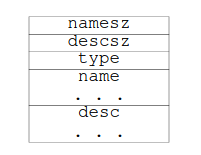
The first two fields of the segment are fairly self explanatory, they represent
the size of both the name and the descriptor. The name field is a string that
represents the type of note. The desc field is a structure that contains the
actual data of the note. The type field tells us what type of note we are
looking at. It is an unsigned integer that represents the type of note. It’s
worth noting that the name field works as a kind of namespace for the type
field. Two notes with the same type field can be differentiated by their name
field.
The PT_LOAD segment is a bit more straightforward. This represents a segment
of memory that was loaded into the process at the time of crash. These can
represent either the stack, heap, or any other segment of memory that was loaded
into the process.
Coredumps at Memfault: Rev. 1
Our first crack at coredumps at Memfault had one goal: leveraging existing tools to capture info about a crashing process. To have feature parity with our offering on MCU and Android, we needed a few basic things:
- A symbolicated backtrace for each running thread in the crashing process
- The values of registers at the time of crash
- Symbolicated local variables at each frame
Based on what we’ve learned about Linux core files so far, they are an obvious
fit for these requirements. We can use an established system to route
information about crashed processes, add metadata that helps gives us
information the device in question, and do all of this without making any source
modifications to anything running on the system. For this reason our first pass
at coredumps leave them largely untouched from what the kernel provides. The
only addition is a note that contains the metadata we use to identify devices
and the version of software they’re running on. This takes advantage of the fact
that the PT_NOTE segment is a free form segment that can be used to add any
metadata we want to the coredump.
This allows us to gather additional information about the process that crashed, and more easily stream memory to avoid unnecessary allocations or memory usage.
Now that we’ve covered all the background information we can start to dive into
the innards of the memfault-core-handler. First we use the pipe operation that
was outlined earlier.
Here
is the pattern we write to /proc/sys/kernel/core_pattern to pipe the coredump
to our handler:
|/usr/sbin/memfault-core-handler -c /path/to/config %P %e %I %s
This tells the kernel to pipe the coredump to our handler, and provides the
handler with the PID of the crashing process (%P), the name of the crashing
process (%e), the UID of the crashing process (%I), and the signal that caused
the crash (%s).
When a crash occurs the kernel will write the coredump to the stdin of the
handler. The handler will then read all the program headers into memory. This
sets us up to do two things. First we’ll read all of the PT_NOTE segments and
save them in memory. For the first iteration of the handler, we won’t do
anything further with them until we write them to a file. They’ll become more
important in later articles as we get into more of the special sauce of the
handler.
The next thing the handler does is read all of the memory ranges for each
PT_LOAD segment in the coredump. Instead of storing this in memory we’ll
stream it directly to the output file from /proc/<pid>/mem. This is done to
reduce the memory footprint of the handler, and prevent any issues where we
would potentially need to seek backwards in the stream. As mentioned before,
stdin is a one way stream, and we can’t seek backwards in it.
After we’ve written all of the PT_LOAD segments to the output file we should
have an ELF coredump that is largely the same as what the kernel would have
written. The only difference is that we’ve added a note to the coredump, the
contents of which we won’t cover in this article, as it’s not particularly
interesting.
Let’s take a quick visual look at everything we’ve accomplished by annotating our previous ELF layout diagram with the changes we’ve made.
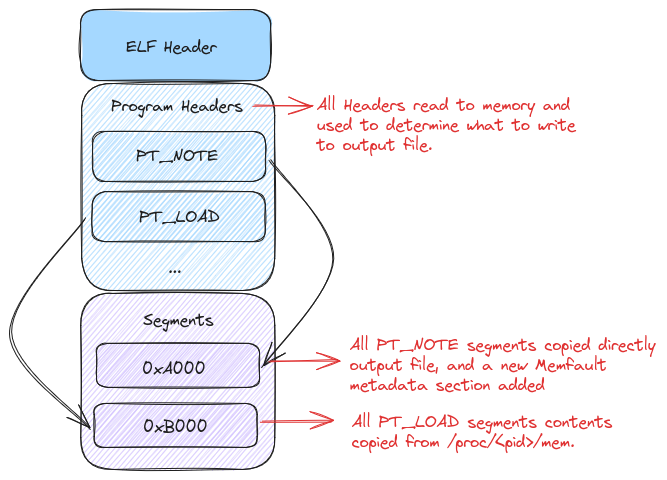
And there we have it! We’ve copied our coredump over from stdin with a few
minor changes. Now you’re probably wondering, why did we go through all of this
trouble to end up with a file that’s largely the same as what the kernel would
have produced? Well for one it allows us to add metadata to the coredump, but it
also sets the stage for more advanced coredump handling in the future that we’ll
cover in the the next article.
Conclusion
We’ve covered the basics of coredumps on Linux, and how they’re used in the Memfault SDK. You should now have a pretty good idea of how things look under the hood. While the baseline coredumps are useful, and a known commodity, there are a few things that aren’t great about them. The biggest issue is that they can be quite large for processes that have many threads, or do a large amount of memory allocation. This can be a large problem for embedded devices that may not have a lot of room to store large files. In the next article we’ll take a look at the steps we’ve taken to reduce the size of coredumps.
In the meantime, if you’d like to poke around the source code for the coredump handler you can find it here.
See anything you'd like to change? Submit a pull request or open an issue on our GitHub
References
 Blake Hildebrand is an embedded software engineer at Memfault. Blake previously worked on embedded software teams at Garmin and Amazon Robotics.